

Admin Console tour
The dashboard, the six navigation groups, global search, and quick actions.
The Admin Console is where you configure and operate the platform. This page orients you to its layout so the rest of the documentation maps cleanly onto what you see on screen.
You reach the console at /admin. Admin sessions are protected and re-prompt for authentication after 8 hours, even if you remain signed in.
The dashboard
The landing page (/admin) summarizes the health and activity of your instance. It is the first thing you see when you sign in.
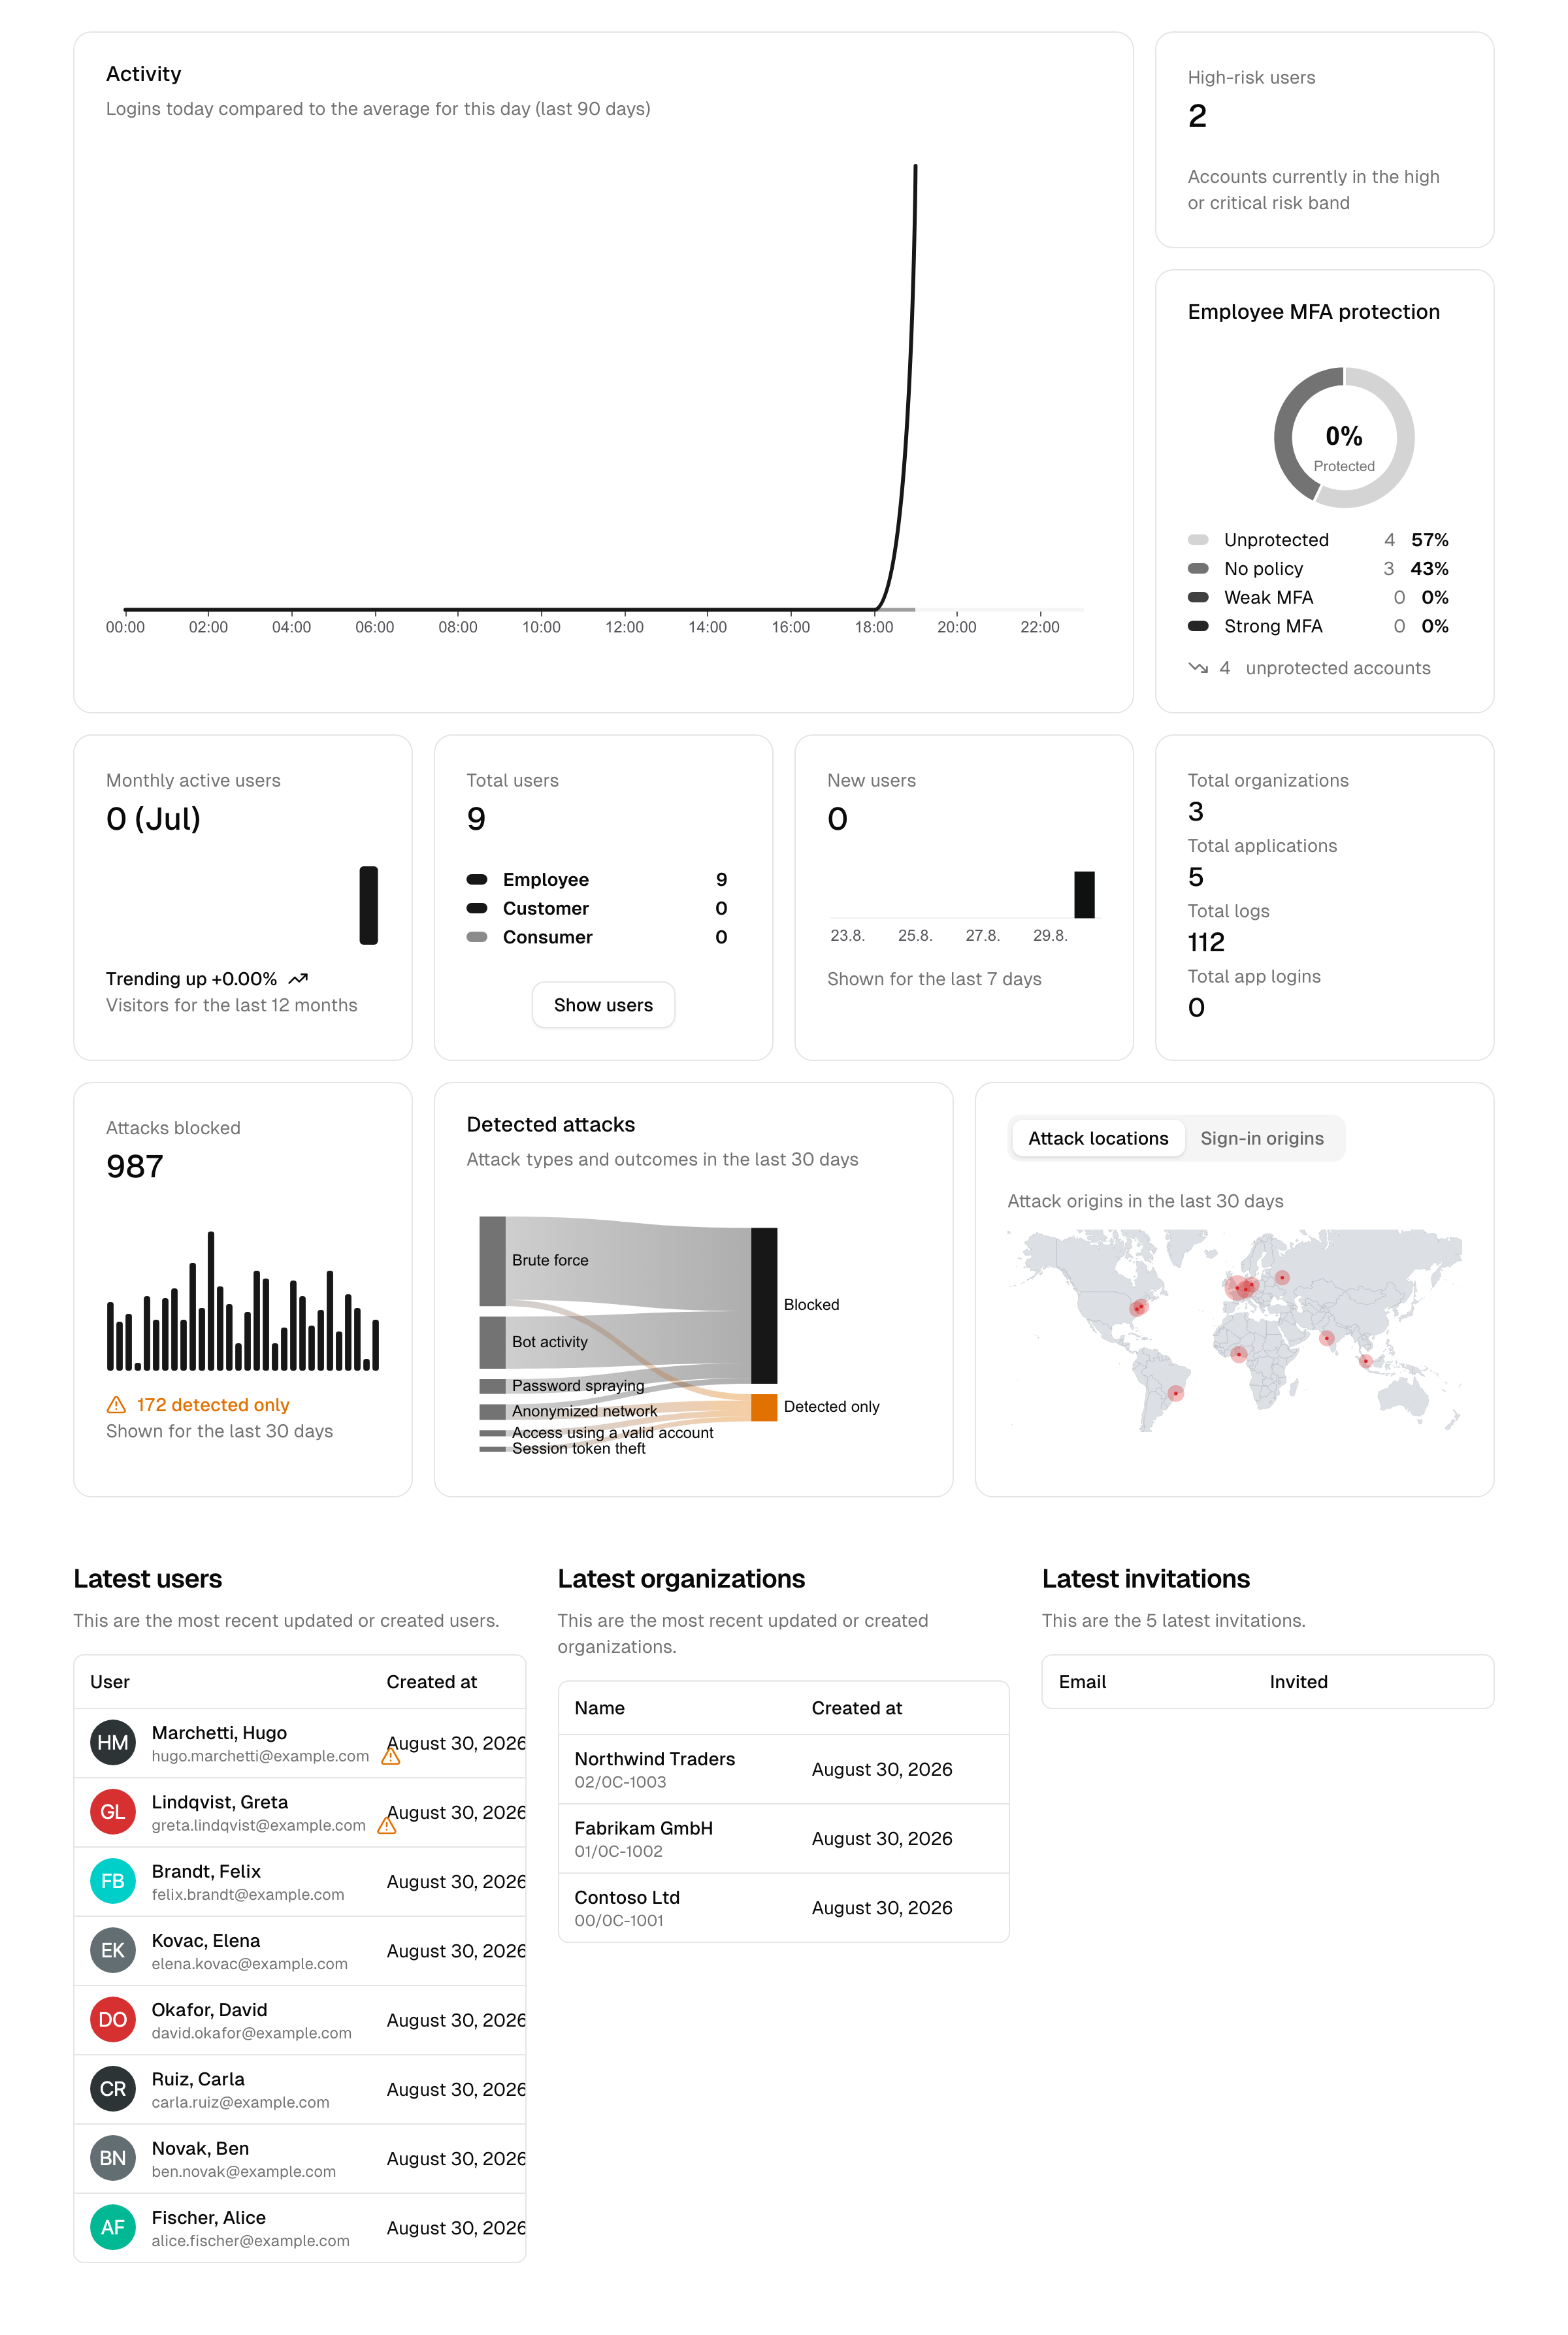
Activity and summary tiles
- Activity chart — today's logins compared to the average for the same weekday over the last 90 days, so a spike or a quiet day stands out at a glance. It refreshes live, without reloading the page.
- MFA Protection — how much of your workforce multi-factor authentication actually covers (see MFA protection at a glance below).
- High-risk users — accounts currently in the high or critical risk band (see Posture risk score).
- Total users — the user count, broken down into employees and (with CIAM) customers.
- Monthly active users — the active-user count for last month with a trend indicator.
- New users — sign-ups over the last 7 days.
- Total applications, Total logs and Total app logins — the size of your app portfolio and of the audit trail. With CIAM, a Total organizations tile appears alongside them.
Below the tiles, an attack-detection row summarizes the attacks against your instance (see Attack detection at a glance below), followed by latest-activity lists with your most recent users, organizations, and invitations (the organizations and invitations lists are CIAM-only).
MFA protection at a glance
The MFA Protection tile (titled Employee MFA protection with the CIAM add-on) answers one question: how many of your employee accounts a second factor really protects. A factor only counts when it is enabled in your MFA settings, so the numbers match what users can actually use at sign-in.
The tile groups every account into one of four states:
| State | Meaning |
|---|---|
| Strong MFA | A phishing-resistant factor is enrolled (a security key or device biometrics). |
| Weak MFA | Only an authenticator app or SMS is enrolled. Protected, but phishable. |
| No policy | Nothing is enrolled and nothing requires MFA for this account. |
| Unprotected | MFA applies to the account, but no usable factor is enrolled. |
The percentage in the center is your protected share: Strong plus Weak.
An account counts as Unprotected when MFA is mandatory for it (your MFA policy requires it, or the account has admin-console access), or when a factor is enrolled that can no longer be used, for example because that factor type was switched off after enrollment. Those users are prompted to enroll a usable factor at their next sign-in.
The link at the bottom of the tile opens your user list filtered to the unprotected accounts, so you can act on them directly. The tile covers your employees; with CIAM, the same breakdown per audience (external users included) sits at the top of the Multi-factor authentication settings page.
Attack detection at a glance
The attack-detection row shows how the platform's threat protection is holding up. All numbers cover the last 30 days.
The Attacks blocked tile counts sign-in attacks that a protection interrupted: brute-force and password-spraying throttles, account lockouts, blocked breached-password logins, blocked anonymized networks, requests the bot detection rejected as clear bots, and terminated suspicious sessions. Below the trend it also shows how many attacks were detected only in the same window, meaning they were not blocked. Show in audit log opens the audit log on the Attacks view for the same 30 days.
The Detected attacks chart breaks the attack volume down by type — brute force, password spraying, access using a valid account, session token theft, anonymized networks, and bot activity — and by how each was handled: Blocked means a protection interrupted the attempt; Detected only means it was seen but went through, and deserves attention (for example, a successful sign-in with a password known to be breached).
The Attack locations map places the attack volume on a world map by place of origin, down to city level; places too close together at the current zoom merge into one bubble. A second tab, Sign-in origins, shows the same map for successful sign-ins instead, taken from the audit log of the last 30 days. When all the activity comes from one region, the map zooms in on it automatically. Both require geolocation; with geolocation disabled or unavailable, the card shows a placeholder instead. Keep in mind that locating an IP address is approximate: a bubble marks the provider's network location near the origin, not an exact spot. Clicking a bubble opens the audit log filtered to that country for the same 30 days (the Attacks view on the attack map, successful sign-ins on the sign-in map). The map counts protection events and the log lists audit entries, so the two numbers need not match exactly: a throttled attempt, for example, is counted on the map but leaves no entry of its own.
Note: The attack counters start collecting when you install a release that includes this section — earlier events are not counted retroactively.
Global search
The search box in the top bar returns grouped results across users, organizations, and applications. Type a name, email, login identifier, or client ID; each result links straight to the matching record. Newly created or just-synced records appear immediately.
Switch organization view
Add-on required: This appears only with the CIAM (B2B) add-on, and only for admins who can read organizations.
You can switch the console to view one customer organization's data, reproduce what that customer sees, then leave the view to return to the full instance. Starting and ending the switch are recorded in the audit log. See User lifecycle → Impersonation for the details.
Navigation groups
The sidebar is organized into six groups that follow the lifecycle of identity and access. Each item below names the one or two tasks most admins start there, so you can map a goal to the right area on first read.
Dashboard & quick actions
- Dashboard — overview metrics and global search.
- Your tasks — work waiting on you, such as pending approvals. See Your tasks & approvals.
- Getting started — a guided setup checklist for new instances, tailored to your focus by a short set of questions on first visit.
Directories
- People — your users (employees, and with CIAM, customers and consumers), plus invitations. Start here to create, invite, edit, or off-board a user.
- Groups — collections of users for shared access and roles. Start here to bundle access and assign it to many users at once.
- Organizations (CIAM-B2B) — business customers within your instance. Start here to onboard a customer org and delegate its administration.
- Device inventory (DIAM) — enrolled endpoints. Start here to review device posture or isolate a compromised device.
- User directories — your local and enterprise (AD/LDAP) directories. Start here to set a password policy, session timeouts, or configure directory sync.
Integrations
- Applications — the apps that use the platform for single sign-on. Start here to connect an app and assign it to users.
- APIs — protected resources and their scopes for machine-to-machine access. Start here to define an API and test a token.
- Roles (RBAC) — custom roles and their permissions. Start here to bundle permissions and assign them.
- Connections (CIAM / enterprise brokering) — external identity providers you federate to. Start here to add a social or partner login.
Security
- Conditional access — authentication policies, device compliance policies, and network zones. Start here to require MFA only under risky conditions.
- Workflows (workflows) — approval-flow configuration. Start here to require approval before access is granted.
- Threat protection — bot, brute-force, IP-throttling, and breached-password controls. Start here to harden the login surface.
- Multi-factor authentication — global MFA policy and factors. Start here to enable factors and set the default MFA requirement.
- Security health — configuration scoring against security frameworks. Start here to find and fix weak spots.
- Admin console users — your administrator team and their access levels. Start here to add an admin with least privilege.
Audit trail
- Logs — the tamper-evident audit log. Start here to investigate who did what, and when.
- Approvals — the approval inbox. Start here to decide pending access requests.
- Issues — system issues and anomalies. Start here to triage automatically-surfaced problems.
- Rate limits / blocked IPs — currently throttled or blocked addresses. Start here to unblock a legitimate address caught by throttling.
Settings
- System — general, license, login, signing keys, and advanced configuration.
- Branding — appearance, email provider, and SMS provider.
What you can do depends on your access level
Menu items and actions are filtered by your admin access level. An auditor sees read-only views; an operator can make day-to-day changes; an owner has full control. Feature-gated areas (marked above) only appear when your plan and add-ons include them.
For developers: the API documentation
If you are wiring up the management API, the console ships interactive API documentation at /admin/api-docs — a browsable reference you can try directly, plus a downloadable OpenAPI definition. See Integrations → APIs for how to obtain a token and call it.
Where to go next
- Brand-new instance? Follow the first-steps checklist.
- Want the conceptual overview first? Read the introduction.